Using visualization packages#
AEN supports multiple visualization packages for Python and R language.
For Python, the default environment has Matplotlib and Bokeh installed.
For R language, the default environment has r-ggplot2 and r-bokeh installed.
Matplotlib#
Matplotlib is a Python 2D and 3D plotting and visualization library that produces publication-quality figures in a variety of hardcopy formats and interactive environments across platforms.
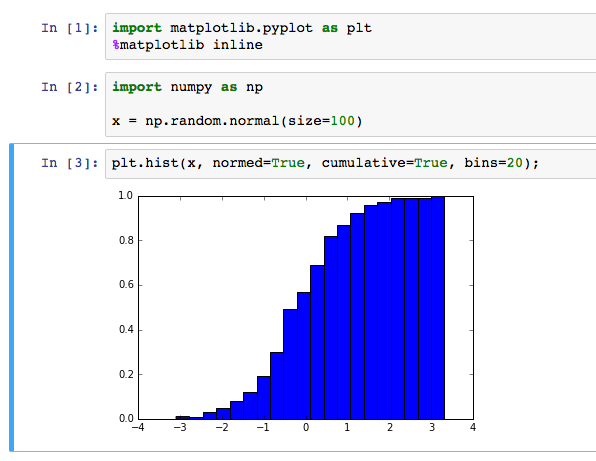
To display Matplotlib figures in the output cells of a notebook running the default environment, run:
import matplotlib.pyplot as plt
%matplotlib inline
Any Matplotlib figures in the notebook are displayed in it’s output cells.
EXAMPLE: The following screenshot is of a cumulative density function (CDF) plot using values taken from a normal distribution:
For more information, including a gallery, examples, documentation and a list of plotting commands, see the Matplotlib website.
Bokeh#
Bokeh is an interactive visualization library that targets modern web browsers to provide elegant, concise construction of novel graphics.
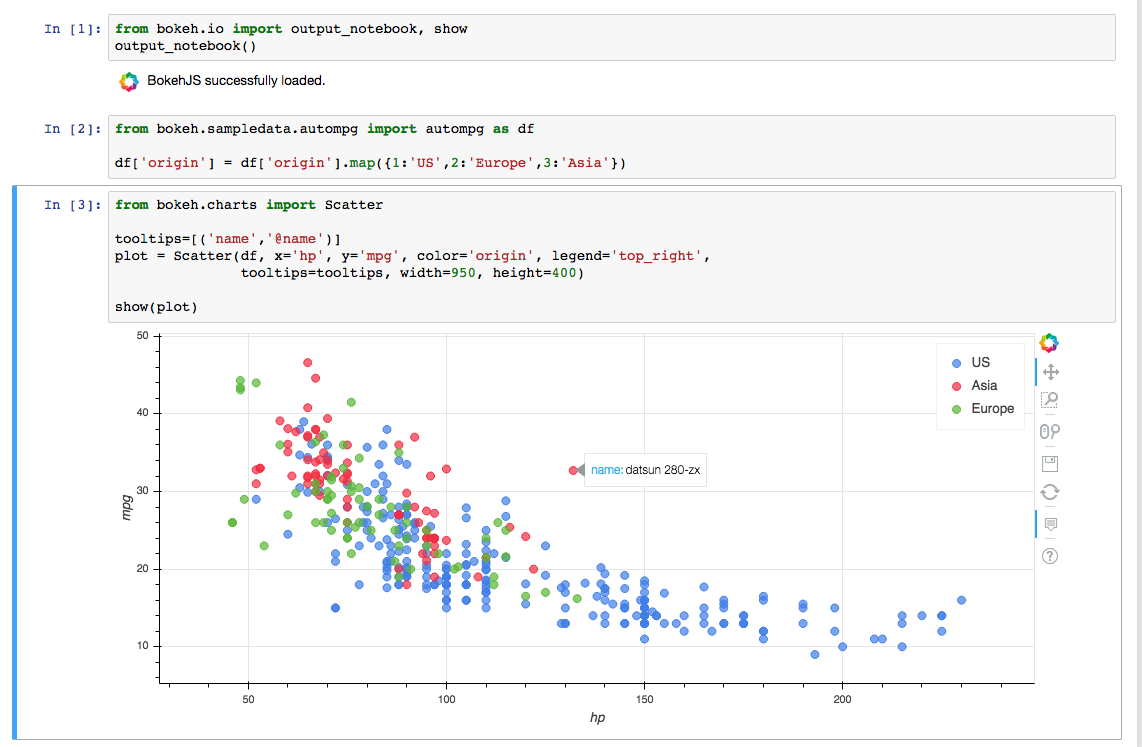
To display Bokeh figures in the output cells of a notebook running the default environment, run:
from bokeh.io import output_notebook, show
output_notebook()
Any Bokeh figures in the notebook are displayed in its output cells.
The following screenshot is of a scatter plot of miles-per-gallon vs. horsepower
for 392 automobiles using the autompg sample dataset:
ggplot2#
Ggplot2 is a plotting system for R language which is based on the grammar of graphics. Ggplot2 tries to take only the good parts of base and lattice graphics and none of the bad parts.
To use ggplot2 with AEN:
Open a new Notebook using the R kernel.
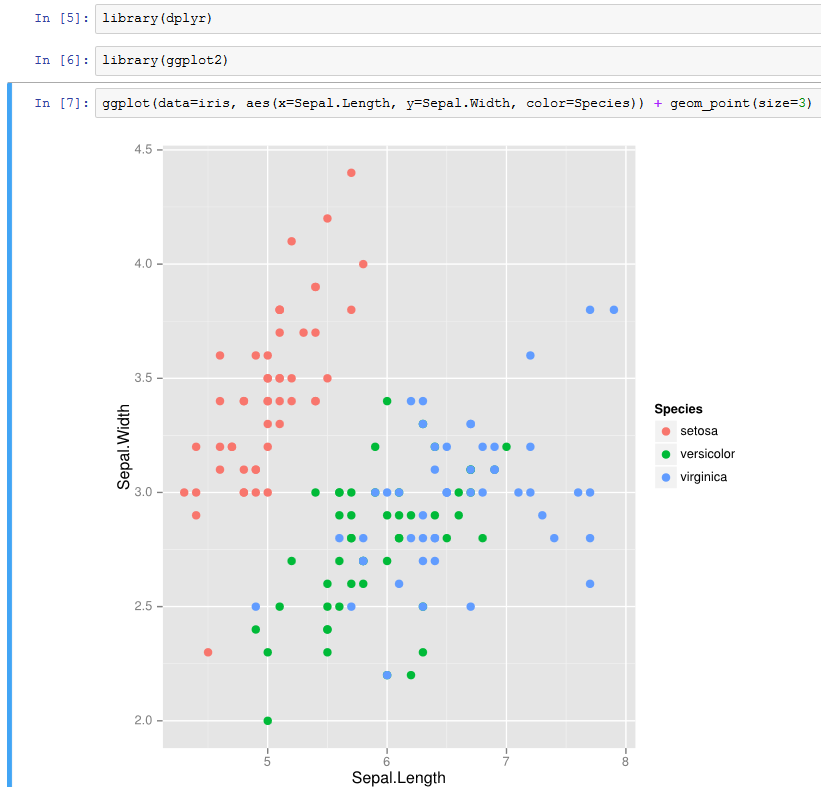
Load the ggplot2 library with the following code:
library(ggplot2)
The ggplot2 library is loaded and ready for use in AEN.
The following screenshot is of a scatter plot of sepal width vs sepal
length using the iris dataset provided by the dplyr library: